← Daniel Bloom/03 · Performance Optimization
One stack: 80% faster. CPU 74%. DB use 64%.
A walkthrough of a full-stack performance program: the bottlenecks I found, what the fix looked like, and the impact on users and infrastructure.
The headline
Avg. latency reduction on key shop page
Discrete bottlenecks identified and fixed
Server CPU reduction
01 · OPcache
Fix OPcache in Prod
The site was sluggish. Every request paid the cost loading code, adding 100s of milliseconds.
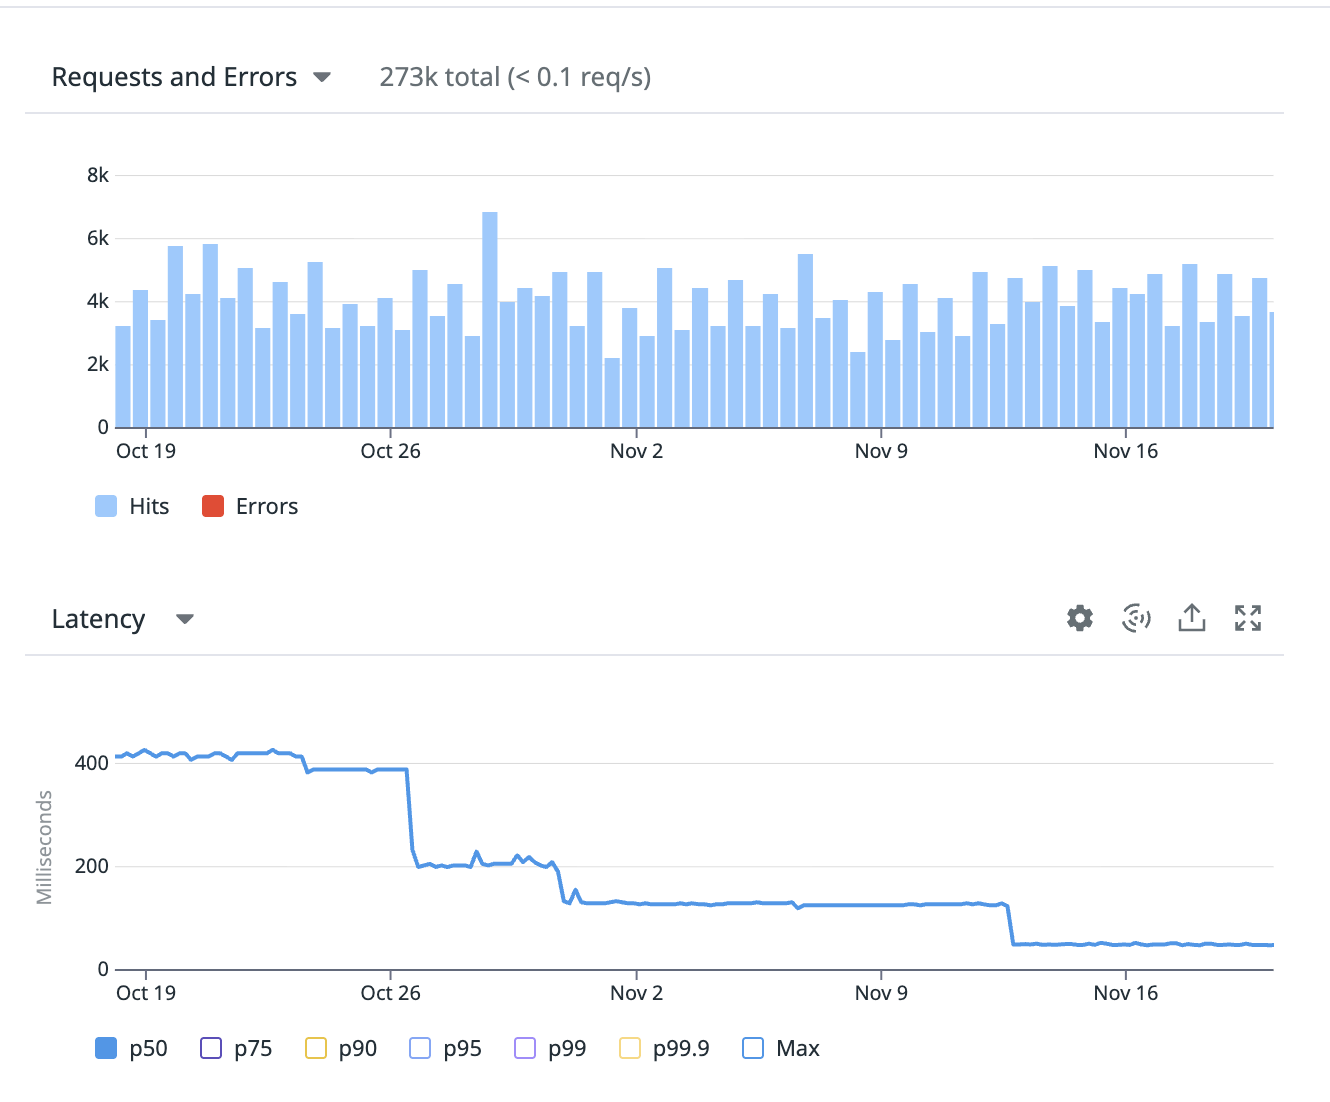
Enabling OPcache with the right settings produced a single sharp inflection point — P95 dropped by over 50% within one deploy, CPU plunged.
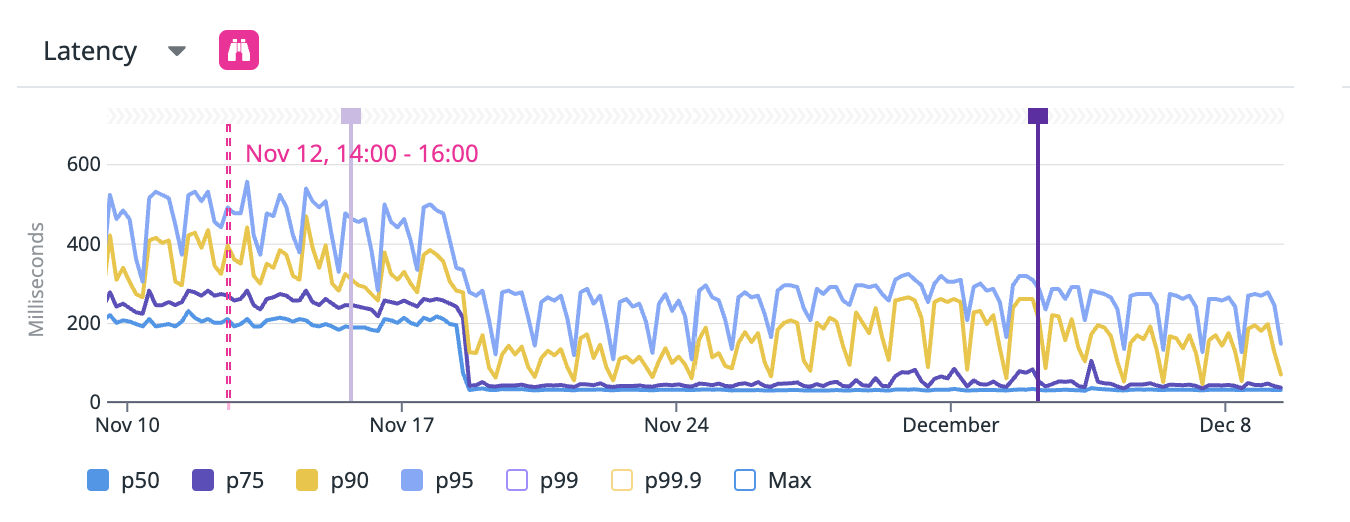
02 · Redis
Shift load from db to Redis
Key endpoints were making dozens of db reads on every request, putting strain on the db and adding tens of milliseconds to latency.
Using Datadog we identified and expensive and duplicative db reads and moved them to a Redis cache, improving latency and db stability
03 · Component cache
Aggressively cache components
A number of resource-intensive SSR components were slowing the site.
Aggressively cached in Redis all components that did not need to be dynamically generated for each user.
04 · CDN
Shift load from servers to CDN
A number of static assets were being served from the servers, increasing the load and the number of Kubernetes resources required.
Updated CI/CD pipelines so that static assets were sent to S3 and served from the Cloudfront CDN. This dramatically reduced page load time and cut our AWS compute costs.
05 · API concurrency
Parallelized the Shopify calls
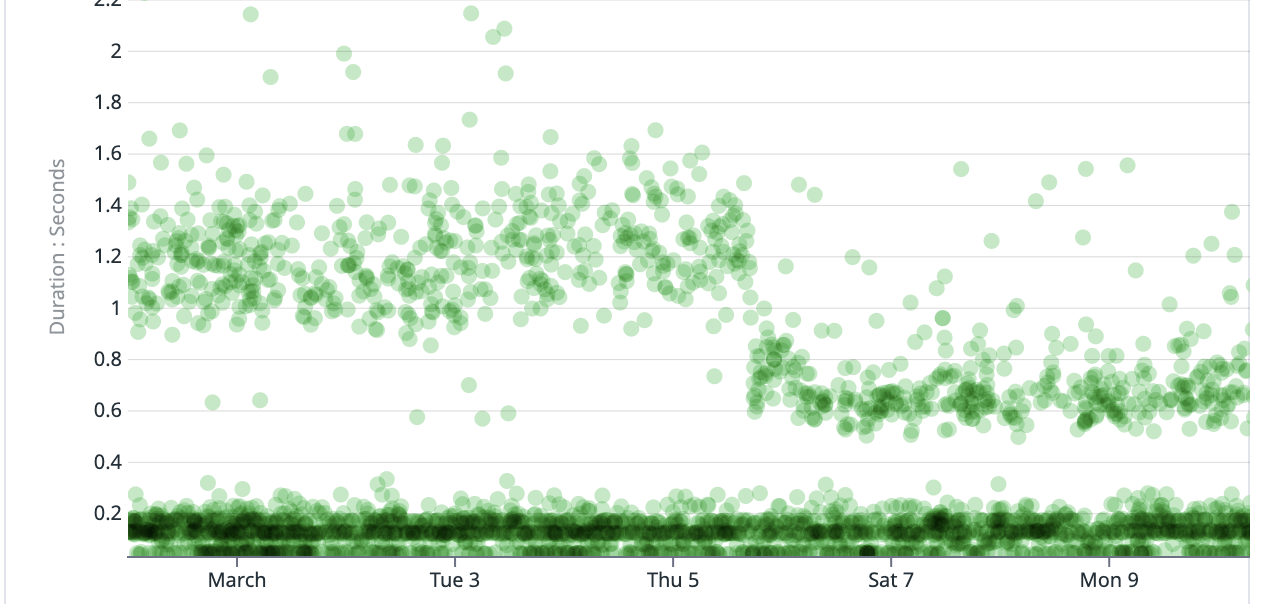
The shop page made multiple real-time calls to the Shopify API per request — one after another. Server response time grew with every hop, and Shopify itself isn't fast.
Parallelized the real-time Shopify calls and layered caching in front. In the scatter, the dense band of sub-200ms responses near the x-axis is the cached path — those requests skip Shopify entirely.
06 · Queues
Shift writes to asynchronous queues
Some user flows, such as interactive quizzes used for lead capture, were slowed by back end writes to different internal systems.
Moved write data onto async queues with ephemeral idempotent workers. Request duration cliff-dropped overnight; failure modes became visible instead of silent.
Cumulative impact
Six fixes, compounding.
Each phase landed independently, but the wins stacked. Better performance led to better SEO and user conversion. Stability and cost savings on infrastructure were a bonus.